Weather Impact Highlights for Retail’s 2024 Calendar Year
The weather is always influencing consumer activity and buying behavior, and the just completed 2024 calendar year for retail once again demonstrated how climate variability impacts sales performance across sectors, product categories, and geographies.

Planalytics’ Weather-Driven Demand (WDD) analytics isolate and quantify the impact the weather alone has on traffic, transactions, and product demand. Below are some monthly WDD metrics that highlight how the weather positively or negatively affected demand this past year. To learn more about weather insights related to your business, visit the Planalytics’ Weather Impact Analysis page.
RETAIL Q1: Widespread warmth east of the Rockies provided a favorable backdrop for sales of spring categories
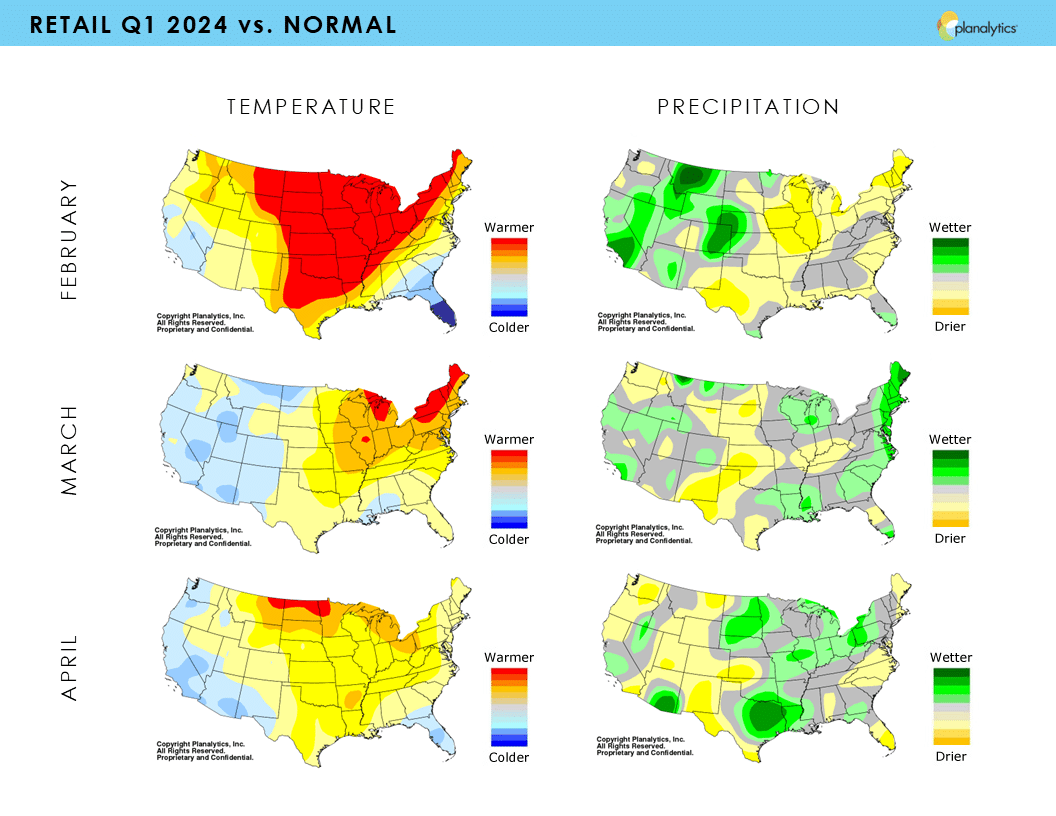
FEBRUARY: U.S. warmest since 2017; driest since 2009; least snow since 1992
Weather-Driven Demand vs. Normal Impacts:
Tee Shirts +5% USA (+18% in Kansas City); QSR Transactions +1% USA (+5% in Detroit); Snow Removal -26% USA (-50% in Buffalo)
MARCH: U.S. warmest since 2020; wettest since 1998; least snow since 2022
Weather-Driven Demand vs. Normal Impacts:
Lawn Fertilizer +2% USA (+6% in Richmond); Rainwear +3% USA (+25% in San Diego); Ice Melt -8% USA (-20% in St. Louis)
APRIL: U.S. warmest since 2017; wettest since 2022
Weather-Driven Demand vs. Normal Impacts:
Shorts +4% USA (+16% in Indianapolis); Lawn Mowers +4% USA (+14% in Harrisburg); Sandals +4% USA (+15% in Cleveland)
RETAIL Q2: Strong spring season continued with warm May; Mixed weather impacts through early summer
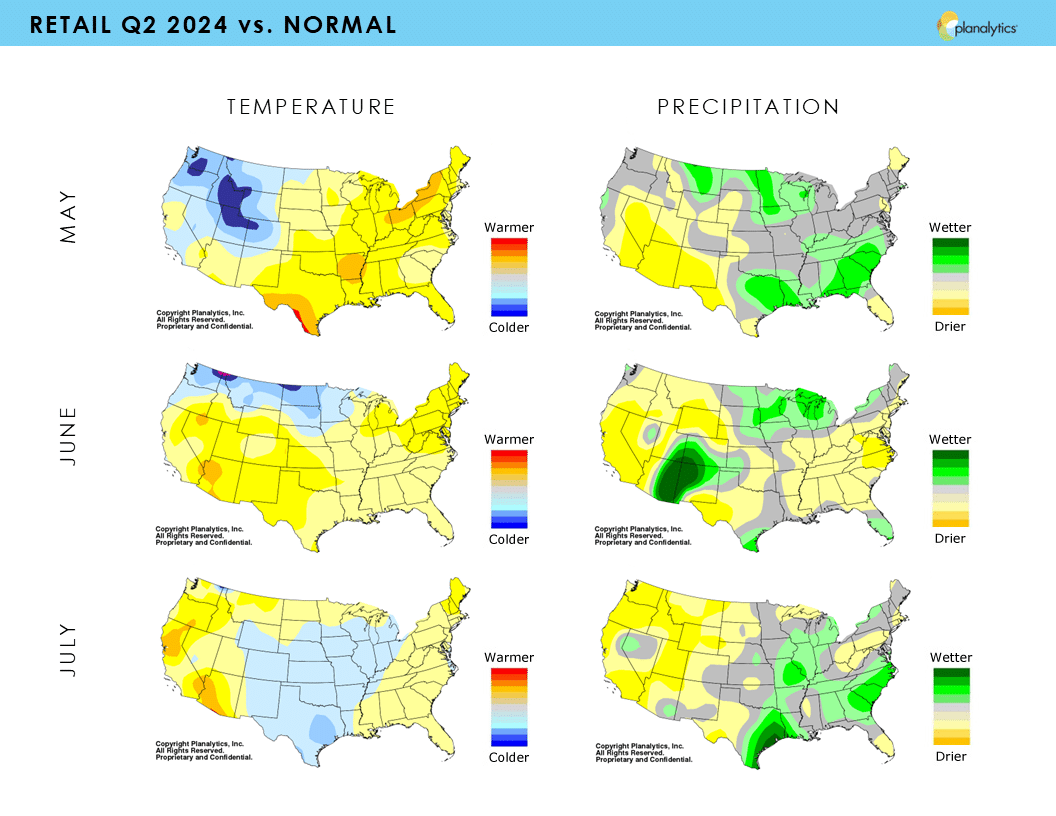
MAY: U.S. warmest since 2018; driest since 2020
Weather-Driven Demand vs. Normal Impacts:
Pool Chemicals +4% USA (+27% in Miami); Home Center Transactions +1% USA (+8% in Syracuse); Sports Drinks +2% USA (+8% in San Antonio)
JUNE: U.S. hottest in over 60 years; wettest since 2021
Weather-Driven Demand vs. Normal Impacts:
Packaged Ice +3% USA (+13% in Atlanta); Bottled Water +2% USA (+5% in Palm Springs): Swimwear +2% USA (+6% in Pittsburgh)
JULY: U.S. warmest since 2006; driest since 2022
Weather-Driven Demand vs. Normal Impacts:
Air Conditioners +4% USA (+31% in Albany); BBQs/Grills +1% USA (+8% in Boston); Pool Toys +2% USA (+8% in Spokane)
RETAIL Q3: Warmth in western & central markets negatively impacts seasonal demand

AUGUST: U.S. coolest since 2017; wettest since 2022
Weather-Driven Demand vs. Normal Impacts:
Fleece +1% USA (+10% in Seattle); Suncare -3% USA (-8% in New York City); Athletic Wear +8% USA (+28% in Los Angeles)
SEPTEMBER: U.S. coolest since 2021; driest since 2017
Weather-Driven Demand vs. Normal Impacts:
QSR Transactions +1% USA (+3% in Minneapolis); Sweatshirts -2% USA (-17% in Phoenix); Bicycles +2% USA (+7% in Hartford)
OCTOBER: U.S. coldest since 2022; driest since 1978
Weather-Driven Demand vs. Normal Impacts:
Soup -1% USA (-7% in Omaha; Capris +7% USA (+35% in Houston); Allergy +2% USA (+6% in Washington DC)
RETAIL Q4: Weather provides boost for holiday period and end of year clearance
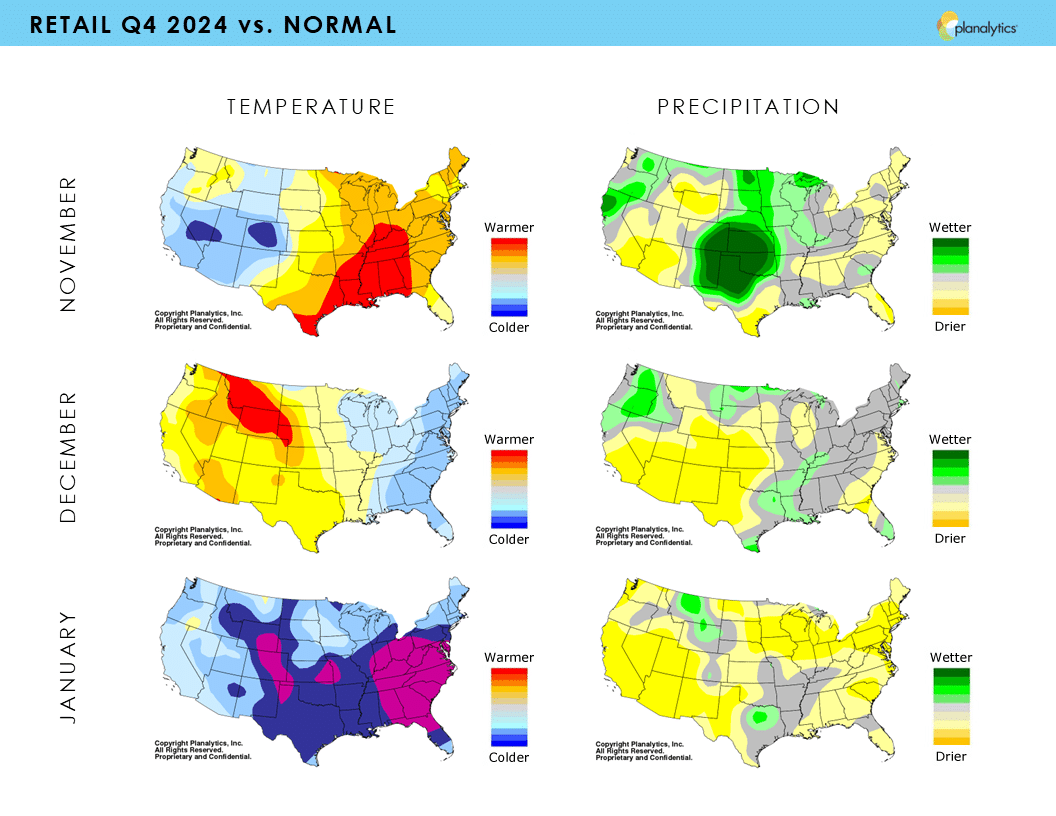
NOVEMBER: U.S. coolest since 2022; wettest since 2018
Weather-Driven Demand vs. Normal Impacts:
Electric Blankets -8% USA (-22% in Knoxville); Heaters -6% USA (-25% in New Orleans); Apparel Transactions -1% USA (-6% in Midland)
DECEMBER: U.S. coolest since 2022; driest since 2021; snowiest since 2022
Weather-Driven Demand vs. Normal Impacts:
Outerwear +1% USA (+6% in Tampa); Snow Throwers +2% USA (+14% in Philadelphia); Boots +1% USA (+8% New York City)
JANUARY (2025): U.S. coldest since 2022; wettest in over 60 years; snowiest since 2019
Weather-Driven Demand vs. Normal Impacts:
Winterwear +8% USA (+16% in Dallas); Auto Batteries +7% USA (+14% in Cincinnati); Winter Base Layers +13% USA (+22% in Charlotte)